Five Python tips for survey data geeks
At Datasmoothie we love Python - we use it all day, every day, to crunch and visualise survey data (and to make tools for others to crunch survey data).
Some things we find ourselves doing over and over, so we thought we'd share with you what they are and how to do them. We'll be using results from the StackOverflow survey of developers as an example, where we've cut it down into a sample we're most interested in: data professionals.
Before we start, we need to read our data into a Quantipy dataset.
ds = qp.DataSet("Stack Overflow")
ds.read_csv('survey_results_public_data_pros.csv')1) Create age bands, converting numbers to single choice variables
Before they are analysed, numerical questions often have to be banded into categorical questions to make them easier to analyse. For example, if you ask someone's age you might want to categorise them into age bands and/or generations.
In this case, we want to analyse the variable YearsCode which shows how many years of coding a respondent has under their belt.
ds.band('YearsCode', [(0,1), (2,5), (6,10), (11,15), (16,20), (21,25), (30,40), (41,50)])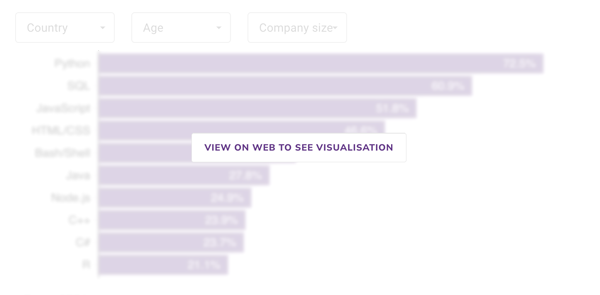
2) Create derived variables
If we look at how Stack Overflow asks about education levels, they include nine answers
ds.meta('EdLevel')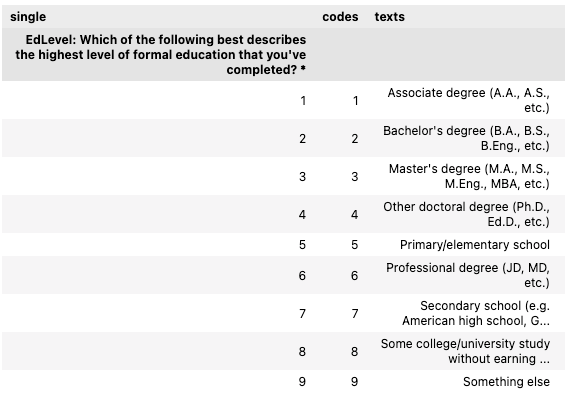
If we want to reduce these to Bachelor, Master's, Doctorates, and Other, we create a derived variable.
ed_mapper = [
    (1, "Bachelor's degree", {"EdLevel":[2]}),
    (2, "Master's degree", {"EdLevel":[3]}),
    (3, "Doctoral degree", {"EdLevel":[4]}),
    (4, "Other", {"EdLevel":[1,5,6,7,8,9]})
]
ds.derive('EdLevel_derived', 'single', 'Education Level', ed_mapper)
This makes it easier to visualise questions like, what operating systems people with different levels of education use?
Derived variables can be very powerful, and can include logic from multiple variables (e.g. "everyone under 30 who has never used Python").
3) Convert a column with comma delimited strings into a multi choice question
When Stack Overflow publish their data, they store their multi-choice variables as delimited strings. So, someone who has both worked with Python and Javascript will have python;javascript as their answer to LanguagesWorkedWith. This is different to how many survey systems store multiple choice questions, as most store them in as many columns as there are answers. But with Quantipy, it's easy to to work with this type of data.
ds.convert('DevType', to='delimted set')That's all there is to it. Now you can use the DevType variable like any other.
4) Running a cross-tab with significance testing
Significance testing, with all the bells and whistles, such as effective base, overlap management etc. is easy.
ds.crosstab('EdLevel_derived', 'OpSys', sig_level=0.05)5) Build Excel tables and PowerPoint decks
Datasmoothie has a cloud-based version of Quantipy which has a one-line interface to generating multiple Excel tables and PowerPoint files.
import tally

ds = tally.DataSet(api_token=[your_token])
ds.use_csv('stackoverflow2021.CSV')

ds.build_powerpoint(filename='my_powerpoint.pptx',
                    powerpoint_template='My_Branded_Template.pptx',
                    x=['q1', 'q2', 'q3'],
                    y=['gender', 'EdLevel_derived']
                    )

ds.build_excel(filename='my_tables.xlsx',
               powerpoint_template='My_Branded_Template.pptx',
               x=['q1', 'q2', 'q3'],
               y=['gender', 'EdLevel_derived'],
               sig_level[0.05,  0.1]
               )
The above will produce one Excel file and one PowerPoint file (branded with any template) with results of the questions provided. This means that with a few lines of code, a user could generate dozens of PowerPoints, each one with a different cut of the data, with a few lines of Python code.
❤️ Liked this content?
📣 Share it with your fellow data geeks on LinkedIn, Twitter or Facebook.
📚 Read more from the archive.
📊 Need help with your own data? Get in touch.
Subscribe to Unprompted Awareness by Datasmoothie
Join hundreds of survey data geeks getting our newsletter
straight to their inbox (it's free)