RIM weighting survey data with Python

A comprehensive guide to RIM weighting and how to weight survey data with Python
In the 2016 presidential race, The New York Times ran a story called How One 19-Year-Old Illinois Man Is Distorting National Polling Averages. The story casts the spotlight on a young, black man who was both an ardent Trump supporter and a panellist in the Los Angeles Times Daybreak poll.
In some polls, he’s weighted as much as 30 times more than the average respondent, and as much as 300 times more than the least-weighted respondent.
How can one person’s opinion skew an entire poll? This illustrates the power — and pitfalls — of weighting survey data.
About survey data weighting
Weighting survey data refers to the practice of adjusting the responses of individual respondents in order to correct for biases or imbalances in the sample.
Weighting involves assigning a weight to each respondent in the sample — a numerical value — that indicates how much more or less representative that respondent’s responses are compared to the average respondent.
The practice of weighting involves calculating the right number to assign to each respondent so that their demographic is represented correctly in the polling results.
Every pollster and market researcher uses weighting. But with great power comes great responsibility. Weighting survey results is a potent tool to correct sampling errors, but it can also cause a researcher to influence the results with their own opinion.
Basic weighting done manually
Suppose a poll has responses from 3952 men and 4303. women. The population we are surveying has a gender distribution of 51/49% but in our poll, only 47.9% of respondents are men instead of 49%. This could skew our results towards the opinion of women.
If we count the percentage of men vs women in our dataset using pandas, we get:
values = data['gender'].value_counts()(values/values.sum()).to_frame().round(3)
If we were only correcting for one variable, in this case, gender, calculating the weight factor manually is easy enough: Every man has a weight of 49/47.9 (desired vs actual ratio) and every woman has a weight of 51/52.1. Our weight vector will look like this:
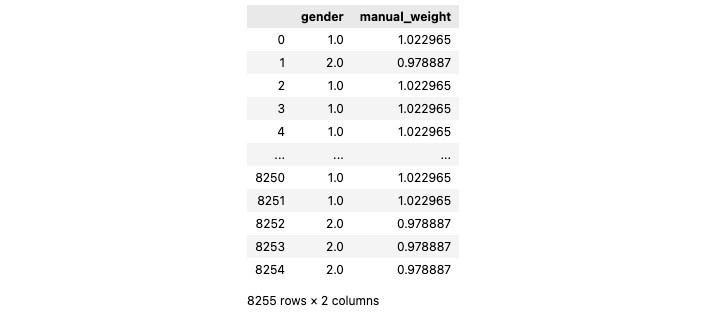
If we use the weight column to count our results rather than the gender column, we get our desired results.
#unweighted
df.groupby('gender')['gender'].value_counts()/df['gender'].count()
#weighted
df.groupby('gender')['manual_weight'].sum()/df['manual_weight'].sum()

But what if we want to add more demographics than just gender? That’s where the RIM algorithm, or the Random Iterative Method, comes in.
Calculating weights across multiple variables: The RIM algorithm
RIM weighting, also known as Raking, applies the same technique described above, except on all the variables we want to adjust and over multiple iterations.
It starts by creating a weight vector for only one variable, exactly like we did above. In the diagram below we call this W1. If the second variable we want to weight is age, the raking procedure would use the weights created from gender to calculate the proportions now represented for age, and so on. One iteration of the RAKE algorithm is completed when all the variables have been used to adjust the weight vector once.
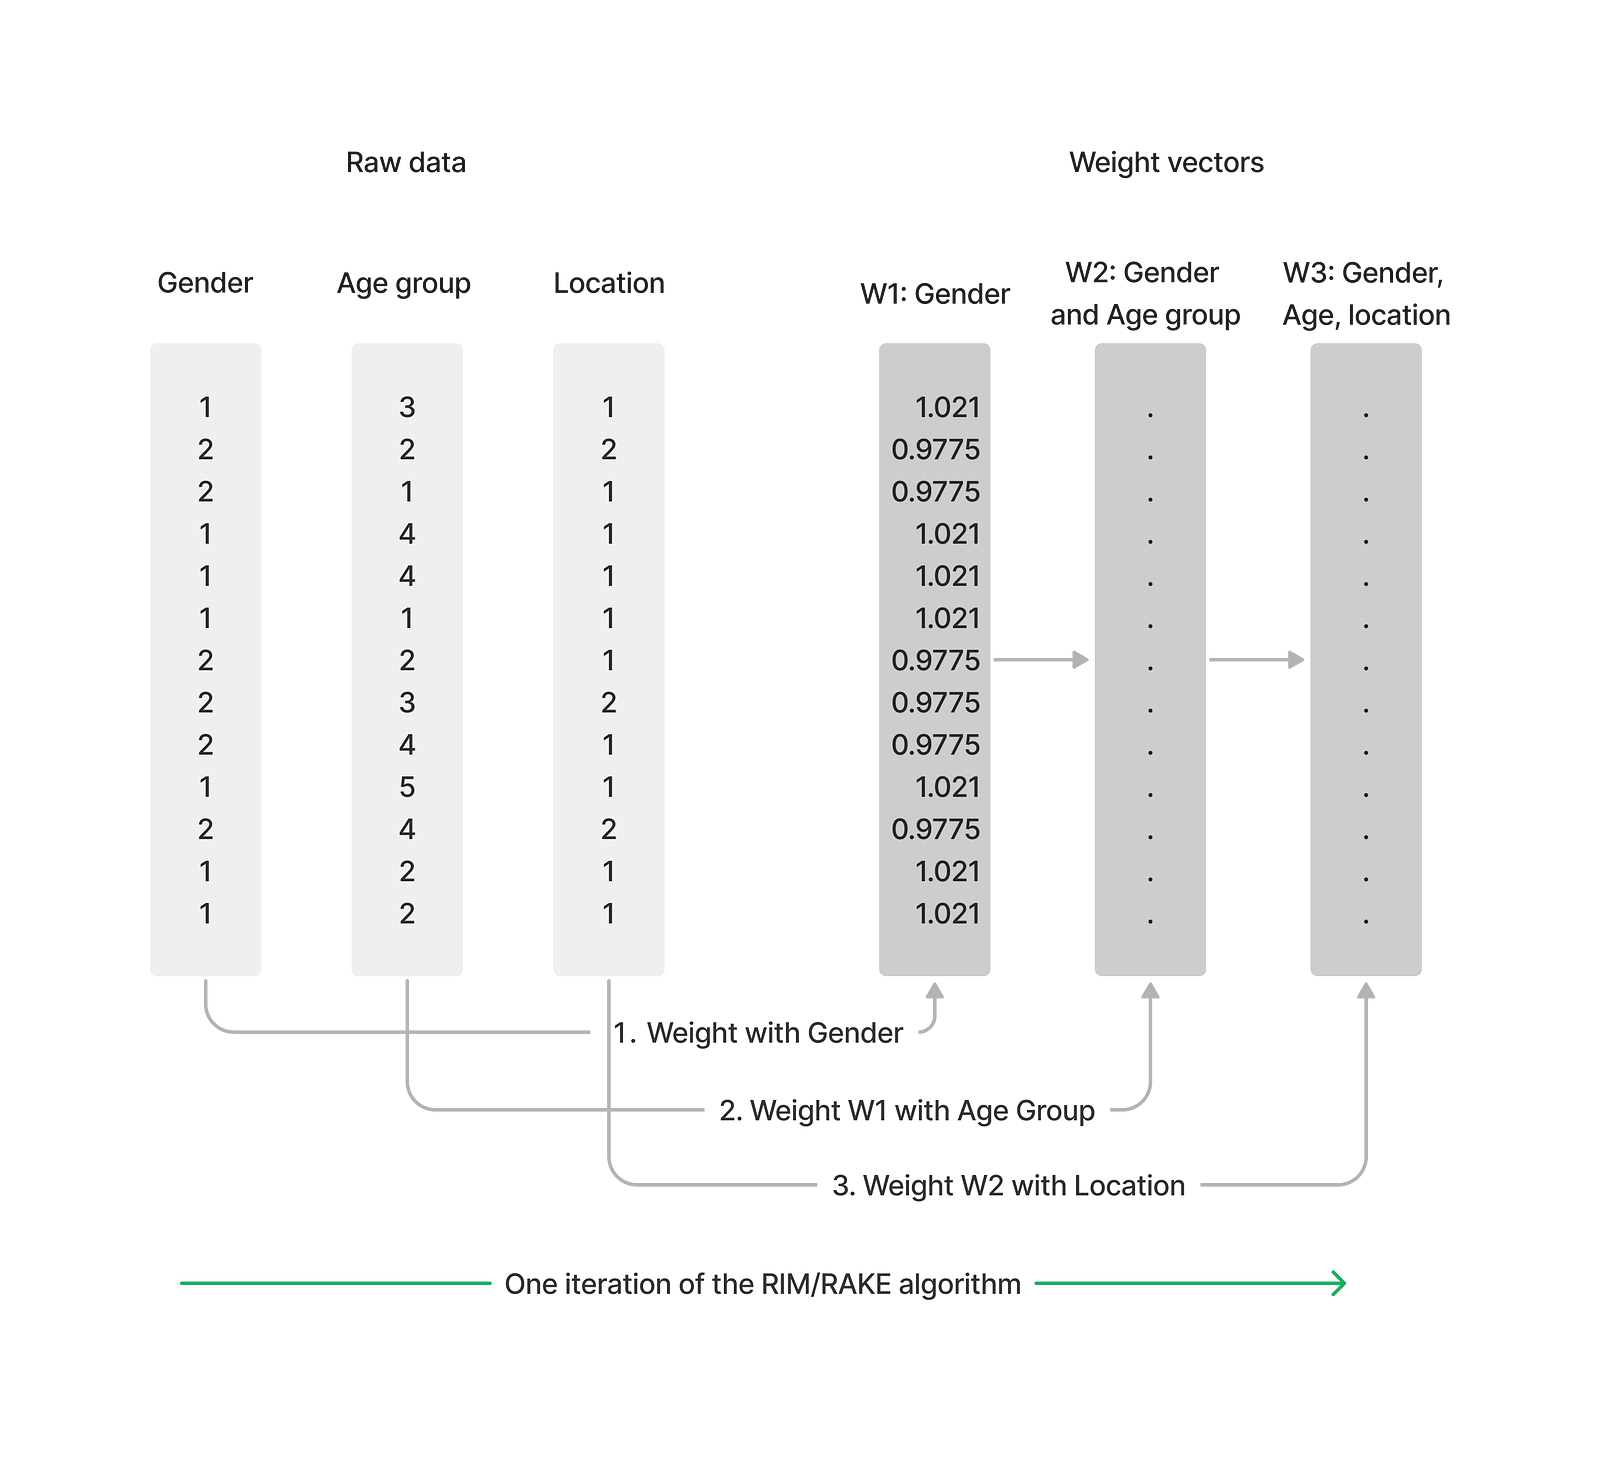
The procedure finishes either when the weighted percentages of all our categories match our targets, or after a set number of iterations if the weights don’t converge.
Applying the RIM algorithm in Python
We use Tally, the enterprise version of the open-source project Quantipy, which specialises in using Python for surveys. Tally can read CSV, SPSS, and Unicom data and connect to major survey data platforms.
import tally
dataset = tally.DataSet()
dataset.use_spss('my_datafile.sav')
In this example, we will use census data as the target schema for our RIM weighting. According to the census data, the following three variables are distributed like so:
- Gender: 51% women, 49% men.
- Age groups: 21% under 18 years, 29% 18 to 39 years, 27% aged 40 to 59 years, and 22% were aged 60 years and over
- Location: 17.1% in rural areas, 82.9% in densely populated areas.
We express this with a python dictionary:
target_schema = {
	'gender':{1:49, 2:51},
	'age_cat':{1:21, 2:29, 3:27, 4:22},
	'location':{1:82.9 , 2:17.1}
}
Our survey divides people’s locations into four different localities, but we only have census data about two, urban and rural. So, using Tally, we create a derived variable to combine the answers in our location variable into fewer answers.
condition_map = [
	(1, "Urban", {'locality':[1,2,3]}),
	(2, "Rural", {'locality':[4,5]})]

dataset.derive(
	name='location',
	label="Urban or rural",
	cond_map=condition_map,
	qtype="single"
)
We then run the weight algorithm using our target scheme.
weight_result = dataset.weight(
	name='My new weight',
	variable='my_new_weight',
	unique_key='unique_id',
	scheme=target_scheme
)
The dataset now has a new variable, my_new_weight, which can be used for all cross-tabs and calculations to weight the survey data. We can check the results with the powerful crosstab method, which we can supply with the variable used to weight results (note the w parameter in the latter cross-tab):
ds1 = dataset.crosstab(
	x=['gender', 'age_cat', 'location'],
	ci=['c%']
)
ds2 = dataset.crosstab(
	x=['gender', 'age_cat', 'location'],
	w='weight_c', ci=['c%']
)
pd.concat([ds1, ds2], axis=1).round(0)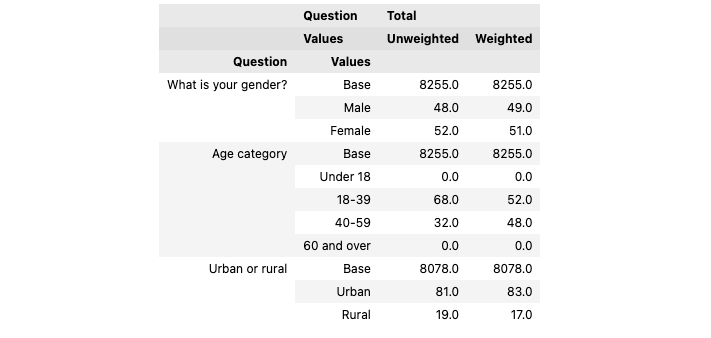
Power and responsibility

Our RIM weighting above was successful, but are we changing the data too much? Will our weights distort the true result of the poll?
We stored the result of our weighting in the variable weight_result and in it, we find the weight report,
weight_result['weight_report']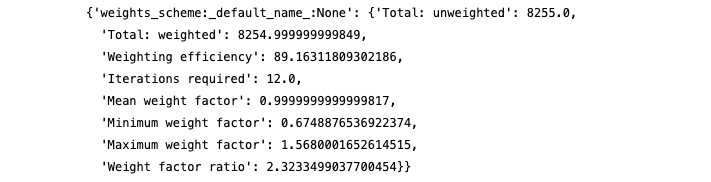
The RIM weighting was successful after 12 iterations. The weighting report generated is to prevent results like the one mentioned above, where one respondent skewed an entire poll.
The unweighted distribution of the respondents was a bit far from our weight targets, so the respondent with the highest weight has a factor of 1.56 (so his opinion weighs 56% more than otherwise) and the person with the lowest weight has 0.67. In order to keep these as close to 1 as possible, a sample should be as representative as possible so the weighting has less work to do.
The New York Times article is about a sample that is so unrepresentative, a person who falls into multiple underrepresented categories is weighted very much, so the poll’s overall results are more representative. The weighting report should always be checked carefully, so the researcher knows they are using their superpowers responsibly.
❤️ Liked this content?
📣 Share it with your fellow data geeks on LinkedIn, Twitter or Facebook.
📚 Read more from the archive.
📊 Need help with your own data? Get in touch.
Subscribe to Unprompted Awareness by Datasmoothie
Join hundreds of survey data geeks getting our newsletter
straight to their inbox (it's free)