Using Twitter as a political polling machine using Tally

Was Matt Hancock more popular than Rishi Sunak in the 24 hours after I’m a Celebrity?
Three days after former UK Health Secretary, Matt Hancock, graduated from his stay at reality TV show I’m a Celebrity … Get me Out of Here, Prime Minister Rishi Sunak and leader of the opposition Keir Starmer sparred in Prime Minister’s Questions (PMQs). Twitter users had an opinion on all three politicians, and expressed these opinions freely.
In the immediate 24 hours after PMQs, which politician got the most negative tweets? And was the difference between the three statistically significant? In this post, we will use the Twitter API, sentiment analysis and Tally, our survey data processing engine, to find out.
Connecting to the Twitter API
Twitter’s API allows developers to search for recent tweets. First, get a developer token for Twitter’s API. Then, create your request header:
bearer_token = YOUR_TWITTER_TOKEN

headers = {"Authorization": "Bearer {}".format(bearer_token),
           "Content-Type": "application/json"}

search_api_path = 'https://api.twitter.com/2/tweets/search/recent'
Next, run the search with your search term. In our case, this will be the names of our politicians.
import requests
search_result = requests.get(
  search_api_path,
  {'query':'rishi sunak lang:en'},
  headers=headers
)
result_json = json.loads(search_result.content)
The result_json object will include the id of every tweet returned along with the text contents.
Sentiment analysis
To run sentiment analysis on our tweets, we use the open-source VADER sentiment analysis. VADER analyses a sentence and gives it a score for positivity, negativity, and neutrality. It also creates a compound score, normalised to be between -1 (most extreme negative) and +1 (most extreme positive), with neutral being between 0.05 and -0.05.
from vaderSentiment.vaderSentiment import SentimentIntensityAnalyzer
analyzer = SentimentIntensityAnalyzer()
When we run the polarity_scores method on different statements, the scores look like this:
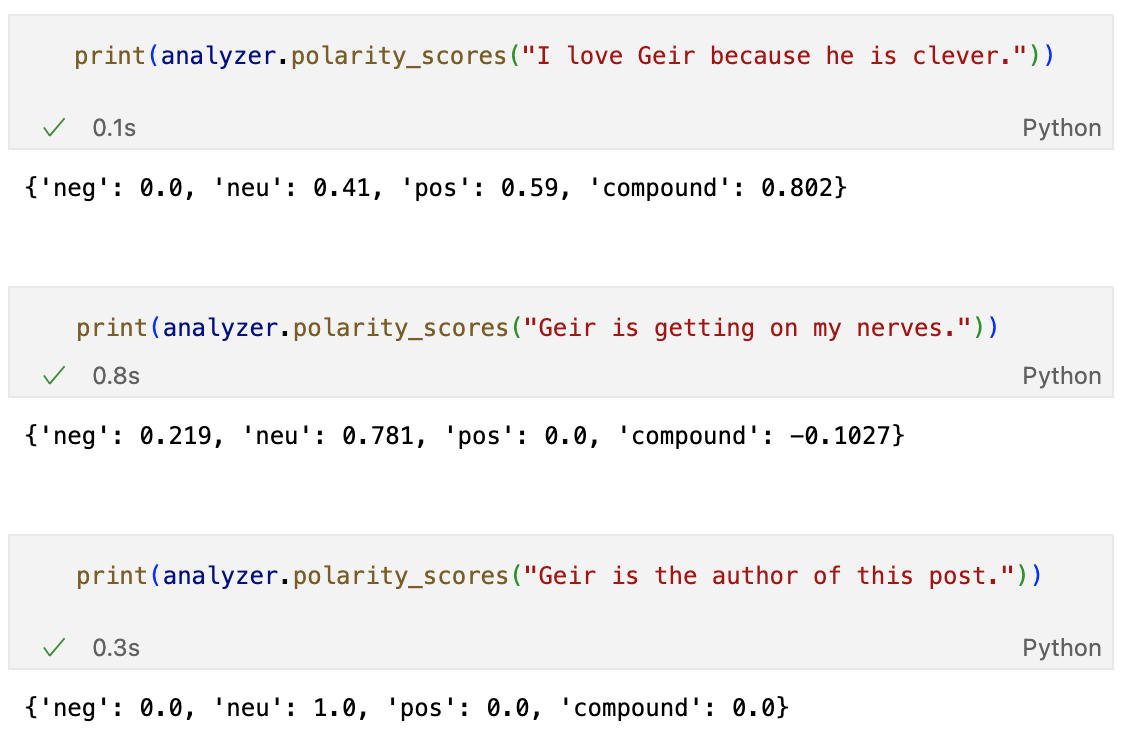
A statement with no emotion gets scored as neutral, with a compound score of 0. Negative and positive statements will get negative and positive compound scores from -1 to 1.
Survey data analysis
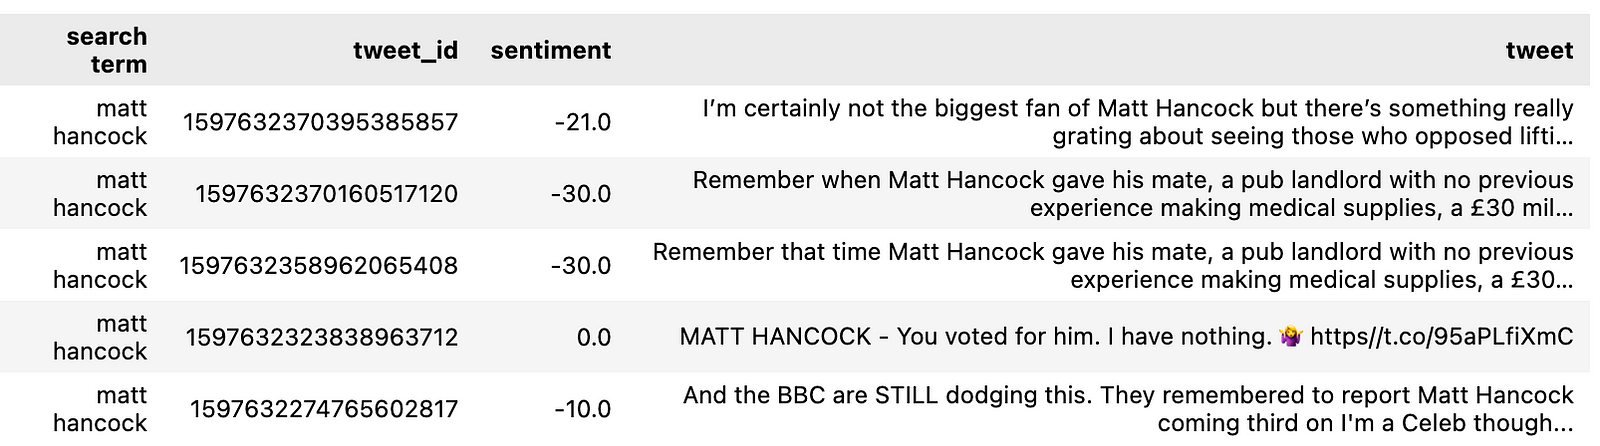
When we’ve queried the Twitter API with our three search terms, we put them into a Pandas DataFrame and store this as a CSV file. Note that we’ve scaled up the sentiment score to -100 to 100, as it’s easier on the eye.
Then we use Tally to help us treat this data as a survey.
dataset = tally.DataSet(api_key=TALLY_API_KEY)
dataset.user_csv('tweet_results.csv')
First, we create a new single-response variable using the derive method so we can categorise the sentiment analysis. Anything higher than 5 is positive and lower than -5 is negative.
condition_map = [
    [1, "Negative", {'sentiment':list(range(-100,-5))}],
    [2, "Neutral", {'sentiment':list(range(-5, 6))}],
    [3, "Positive", {'sentiment':list(range(6, 100))}]
]

dataset.derive(
  name='positive_negaive',
  label="Positive or negative",
  cond_maps=cond_map,
  qtype='single'
)
Now we run the powerful crosstab method, asking for percentage results, the average value and a significance alpha score of 0.05.
# percentages
dataset.crosstab(
  x='positive_negaive',
  y='search term',
  ci=['c%'],
  sig_level=[0.05]
)

#mean
dataset.crosstab(
  x='sentiment', y='search term', ci=[],
  stats=['mean'], sig_level=[0.05]
)
Keir wins, Sunak loses, Hancock is an enigma - interpreting the results
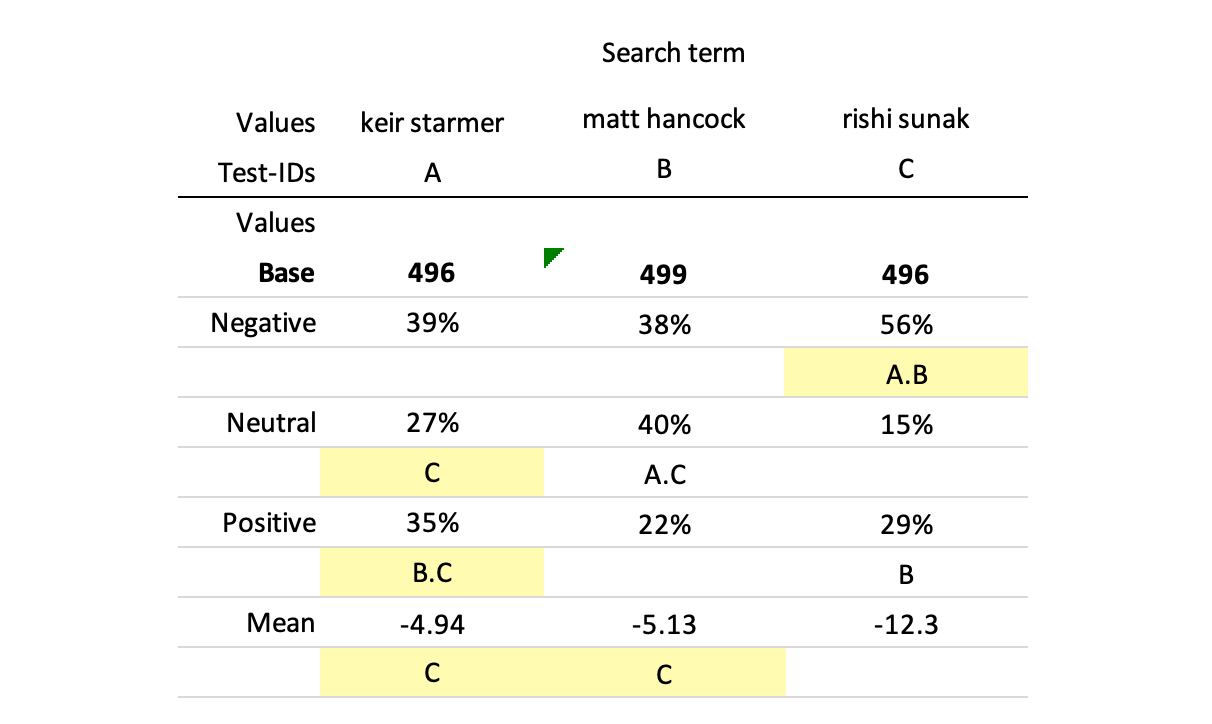
Above is the classic survey data table returned by Tally (for more information on how to interpret survey data tables, click here).
The “A.B” in the Negative row for Sunak means that his negative score, 56%, is significantly higher than those for Starmer (test column A) and Hancock (test column B). Hancock gets more neutral scores than Sunak or Starmer and overall, the average score for Starmer, 1.96, is significantly higher than Sunak’s. According to these results, Matt Hancock, the former health secretary who resigned for breaching covid to have an affair, is more popular than the Prime Minister.
But, beware. These results should be taken with a grain of salt.
The caveats
There are a few things we should beware of. First, we only analysed 500 tweets per politician. If we increase the sample size to 1,000-1,500 tweets per person, we might get more trustworthy results.
Another, slightly bigger caveat, is the current state of sentiment analysis technology. VADER is specifically designed for social media posts, but still has problems with sarcasm, indirect insults and subtlety.
Lastly, we counted retweets as often as we counted the original tweet. The logic is that if a statement is retweeted, that sentiment is being expressed twice. Another approach would be to remove retweets altogether and run the analysis on original tweets only.
To try this out for yourself, the code used to create the above results is available in a Python Notebook.
❤️ Liked this content?
📣 Share it with your fellow data geeks on LinkedIn, Twitter or Facebook.
📚 Read more from the archive.
📊 Need help with your own data? Get in touch.
Subscribe to Unprompted Awareness by Datasmoothie
Join hundreds of survey data geeks getting our newsletter
straight to their inbox (it's free)