Build beautiful Excel tables from survey data with Python
Until now, our Python powered Tally library has focused on scripts used for data processing (clean, weight, recode, etc.).
We are very pleased to announced that we have extended the capabilities of Tally to allow it to produce beautiful Excel tables, so the researchers on our clients' teams have access to high quality tables for their analysis.
Step 1: Load your survey data
First, install the Tally Python client with pip install datasmoothie-tally-client.
Then, import the Tally library, add your API key (email info at datasmoothie.com if you need one) and select your data.
import tally

dataset = tally.DataSet(api_key=YOUR_KEY)
dataset.use_unicom('data/Example_Museum.mdd', 'data/Example_Museum.ddf')Step 2: Decide what variables to include in your tables
The client has helper functions for you to explore your data, like variables, meta, codes, variable_text to show you a list of your variables, and show you meta data, list of codes/answers and the label for a given variable, respectively.
variables = dataset.variables()

banner_vars = ['gender', 'education', 'age']

# add all the single choice variables if they're not in the banner/top
stub_vars = [i for i in variables['single'] if i not in banner_vars]

# add multi choice/delimited set variables
stub_vars = stub_vars + list(variables['delimited set'])
Step 3: Decide on contents, look and feel
We've loaded our data, and we've decided what to include in our tables. Now we create the Excel file.
First we define how our build should look like. All options can be set on a build, sheet or table level. For example, you could add descriptive statistic calculations only on particular sheets, or a single table within a sheet.
build = tally.Build(
    name="Museum project",
    subtitle="Annual research conducted by agency X",
    default_dataset=dataset,
    table_of_contents=True,
    logo='datasmoothie-logo.png'
)

build.options.set_sig_test_levels(0.05) # for sigtests
build.options.set_ci(['c%']) # show only percentages, can also show countsStep 4: Build and save the Excel file
Finally, we create sheets and add tables to them. For this file, we only have one table per sheet, but we can have as many as we need.
for stub in stub_vars:
sheet = build.add_sheet(banner=banner_vars)
sheet.add_table(stub={"x":stub})
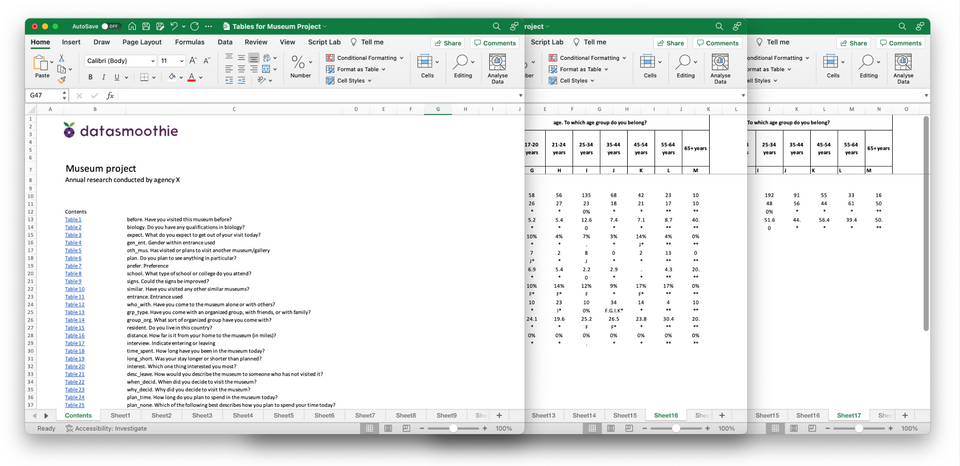
build.save_excel('Tables for Museum Project.xlsx')On your file system you will now have an Excel file with sixty eight tables and an automatically generated and branded front page with a table of contents, which links to the sheets.
❤️ Liked this content?
📣 Share it with your fellow data geeks on LinkedIn, Twitter or Facebook.
📚 Read more from the archive.
📊 Need help with your own data? Get in touch.
Subscribe to Unprompted Awareness by Datasmoothie
Join hundreds of survey data geeks getting our newsletter
straight to their inbox (it's free)