Interactive tables on the web with significance-testing
One of the most powerful features of the Tally API and its front-end, is the possibility to publish online tables, with significance-testing, that are also interactive.
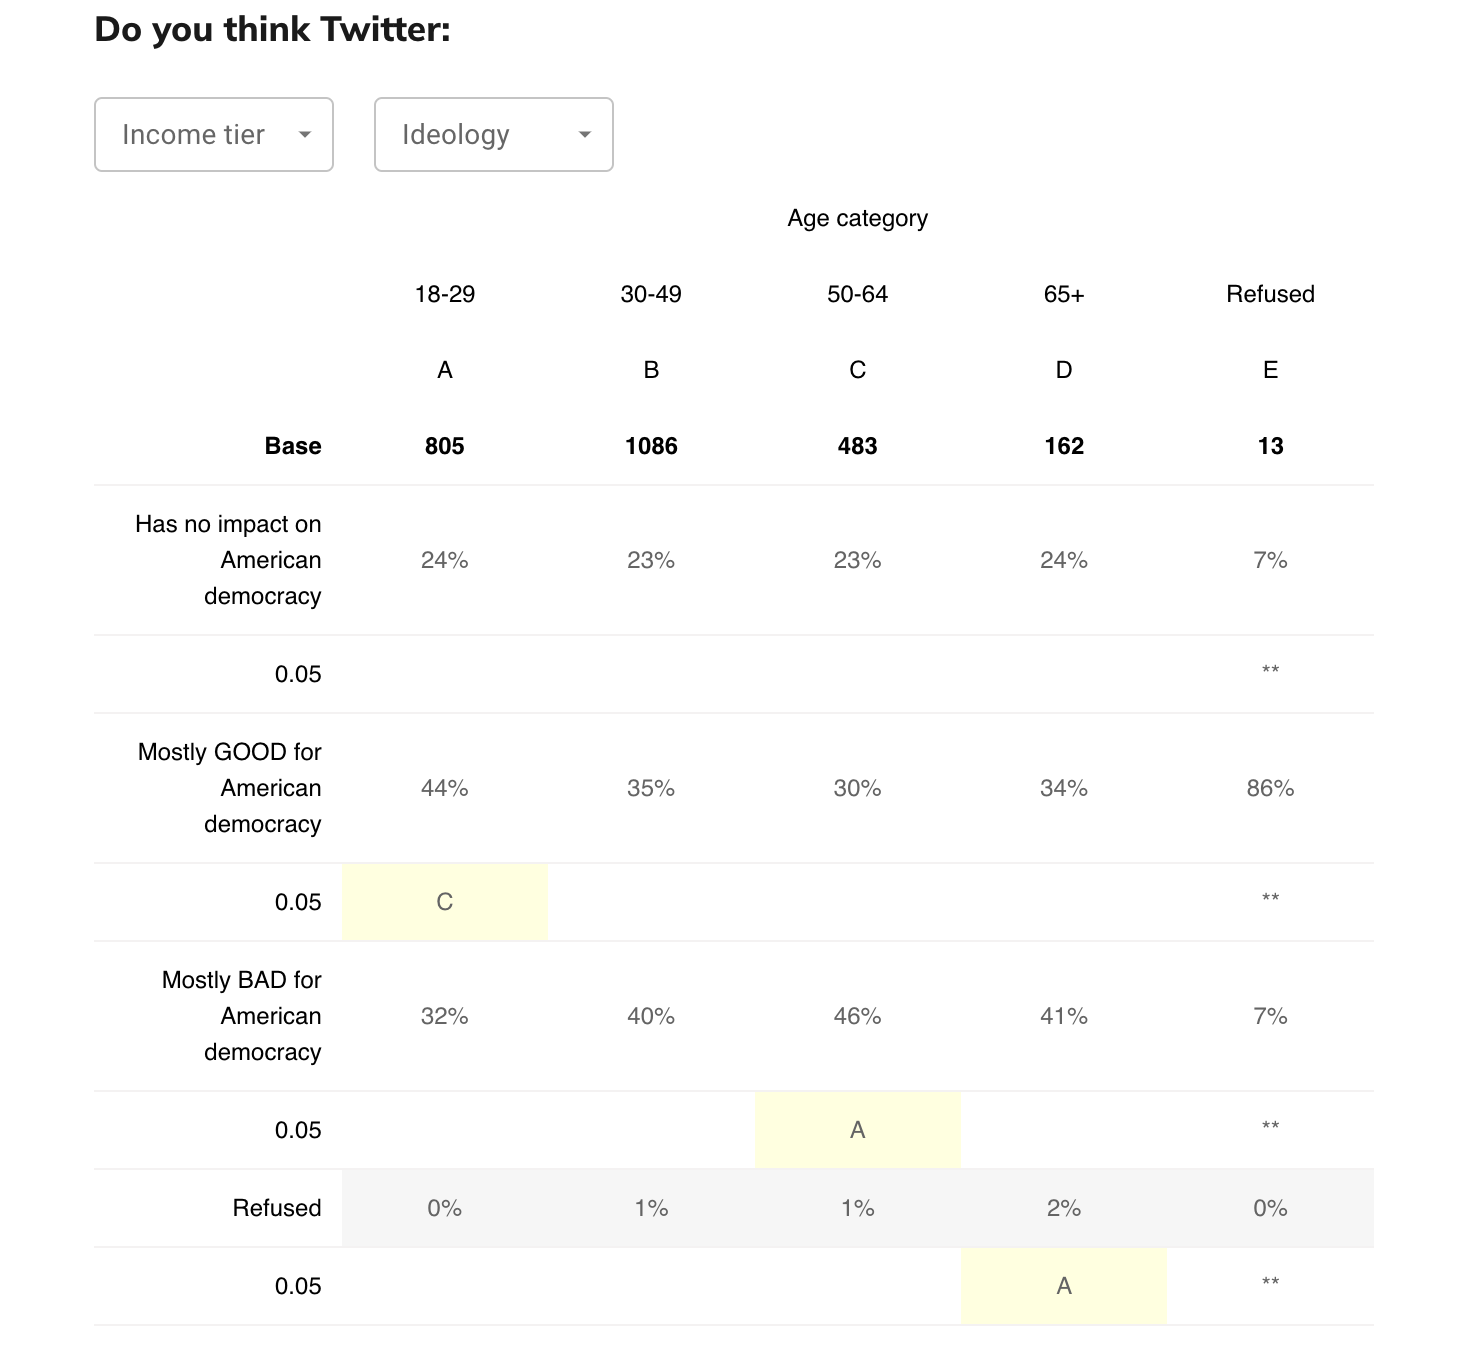
Using data from Pew Research's study on people's attitude towards Twitter, we can simply select what variables to display on the side, what to display at the top and what level of significance it should test for. When you click on one of the filters, the tests are run again and any significance displayed in the table.
The table above is produced by including javascript for the Tally front-end in the page and adding a <div> with data tags that specify what goes into the table.
This allows users to dive deeper into the results, digging out significant results and wheat from the chaff. The significance tests can be configured to mimic popular applications, using effective bases, variance pooling and other methods to control for bias produced by weighting, overlapping samples in the column pairs etc.
❤️ Liked this content?
📣 Share it with your fellow data geeks on LinkedIn, Twitter or Facebook.
📚 Read more from the archive.
📊 Need help with your own data? Get in touch.
Subscribe to Unprompted Awareness by Datasmoothie
Join hundreds of survey data geeks getting our newsletter
straight to their inbox (it's free)